Sonified maps
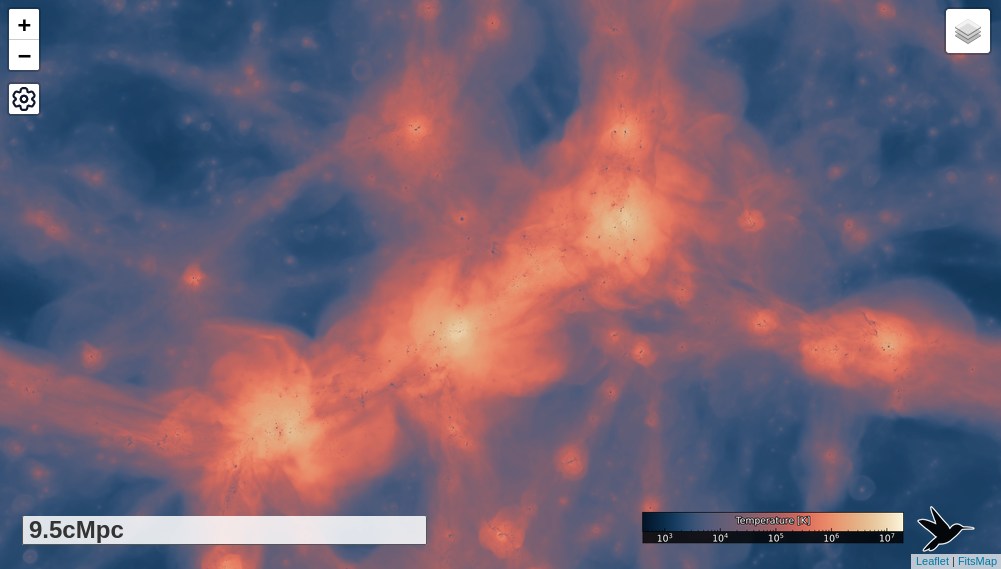
This page contains links to interactive maps of the COLIBRE simulations. The interactive viewer appears as shown in the image on the left. Features include:
- Use the buttons in the top-left corner or the mouse scroll wheel to zoom.
- Click and drag to move around the map.
- Use the icon in the top-right corner to switch between different properties.
- The scale bar in the bottom-left corner shows the length scale for the current zoom level.
- A colour bar in the bottom-right corner represents the property values.
- The highest zoom level of the stellar light maps have been generated using an approximate radiative transfer method. For lower zoom levels the maps are generated using the dust-free luminosities of the stars, and the surface brightness limit has been lowered. As a result, the stellar light maps change in appearance as the zoom level changes.
- For desktop users, sonification can be enabled by clicking the blue "Enable Sonification" button at the top of the page. Once enabled, sound is generated from the data values at the current mouse position, allowing you to also explore different maps through audio as you move the cursor. You can change which property is sonified for the available voices using the selector in the top-right corner.
10 cMpc thick slice through L200m6
10 cMpc thick slice through L400m7
The maps were generated by Rob McGibbon using a modified version of FitsMap. Sonification was developed by James Trayford, as part of the Audio Universe.