Image Gallery
Click on the images to view a larger version
Large-scale structure

The cubic COLIBRE boxes, which have side lengths ranging from 25 to 400 comoving Mpc. Colour shows total surface density (in 5 Mpc thick faces) at redshift z = 0. The available resolution (m5, m6, m7) are indicated. This is Fig. 1 of Schaye et al. (2026).
Visual impression of the dynamic range in the high-resolution COLIBRE simulation L025m5 at redshift z = 0.1. The top left panel shows a projection of the entire simulation with the colour encoding baryon surface density. The other panels zoom into different regions and show the stellar light in HST colours accounting for attenuation by dust. This is Fig. 3 of Schaye et al. (2026).
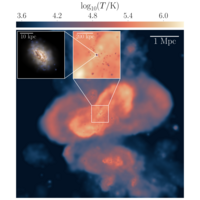
Visual impression of the dynamic range in the L200m6 simulation at redshift z = 0.1. The top left panel shows a 25 cMpc thick slice of the temperature of the gas. The three other main panels show consecutive zooms into the outskirts of a galaxy cluster, keeping the same 25cMpc depth. The two smaller images in the bottom left panel show the stellar light in Euclid colours and account for attenuation by dust. This is Fig. 6 of Schaye et al. (2026).
Visualization of jet activity in the L100m6h simulation at redshift z = 0.2. The background image shows the cosmic web using the gas surface density, while particles kicked into jets by black holes are displayed using both information on the elapsed time since when they were kicked into jets (colour) and their surface density (opacity). Side panels zoom in on individual jets of interest, with further zoom-ins onto their host galaxies (except in the case of a cluster and its BCG) displayed using luminosities in the SDSS i, r and g bands assigned to RGB colours. This is Fig. 1 of Huško et al. (2026).
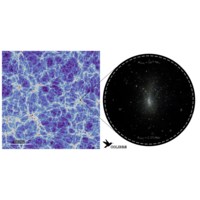
A 25 cMpc thick slice of gas density in the L400m7 simulation, with a zoomed GRI image of a massive cluster with mass 1014.9 M⊙
Galaxies
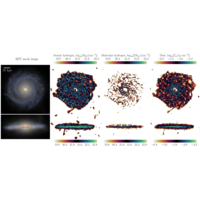
Face-on and edge-on views of a redshift z = 0 disc galaxy of stellar mass 1010.9 M⊙ and SFR = 2.7 M⊙ yr-1 in the L025m5 simulation. From left to right the columns show stellar light, H I column density, H2 column density times 2, and dust surface density. This is Fig. 4 of Schaye et al. (2026).

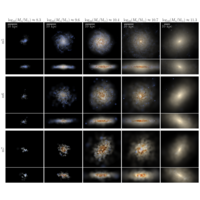
Comparison of galaxy morphologies across different COLIBRE resolutions. Each column shows face-on and edge-on images of the same galaxy in the L025m5 (top), L025m6 (middle), and L025m7 (bottom) simulations at redshift z = 0. The different columns show different galaxies with stellar mass increasing from left to right. The images show stellar light in HST colours and account for attenuation by dust. The stellar masses for m6 resolution are indicated above each column. These can differ by ±0.1 dex for the other resolutions. This is Fig. 5 of Schaye et al. (2026).

Visual impression of the effect of AGN jets on the gas around two star forming galaxies. The main image shows the gas temperature in the hybrid AGN feedback L100m6h simulation at redshift z = 0. The image is centred on a galaxy of stellar mass 1010.4 M⊙, star formation rate 1.6 M⊙ yr-1, and nuclear black hole mass 107.0 M⊙. The other panels show consecutive zooms of the temperature and of stellar light in HST colours accounting for attenuation by dust. Shock fronts driven by AGN jet activity are clearly visible in the main panel, while the jets themselves are also visible in the first zoom-in panel. This is Fig. 7 of Schaye et al. (2026).

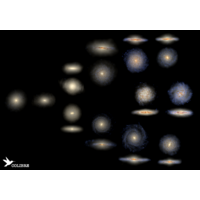
A Hubble tuning fork of redshift z = 0 galaxies in the L25m5 simulation.